Investor Guide
Last updated: October 2023

About us
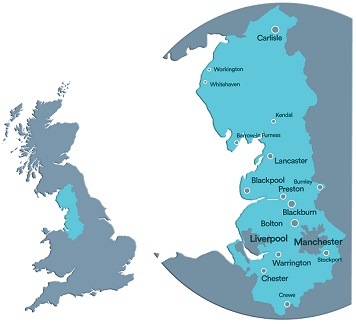
United Utilities is listed on the London Stock Exchange, and provides water and wastewater services to around seven million people and businesses in the North West of England.
Shares also trade over the counter in the USA in the form of American depositary receipts (ADRs). Each ADR represents two ordinary shares.
Shares in issue: c682 million (100% free float)
Our investment proposition
Our purpose is to provide great water for a stronger, greener and healthier North West
This drives us to deliver our services in an environmentally sustainable, economically beneficial, and socially responsible manner and create sustainable long-term value for all.
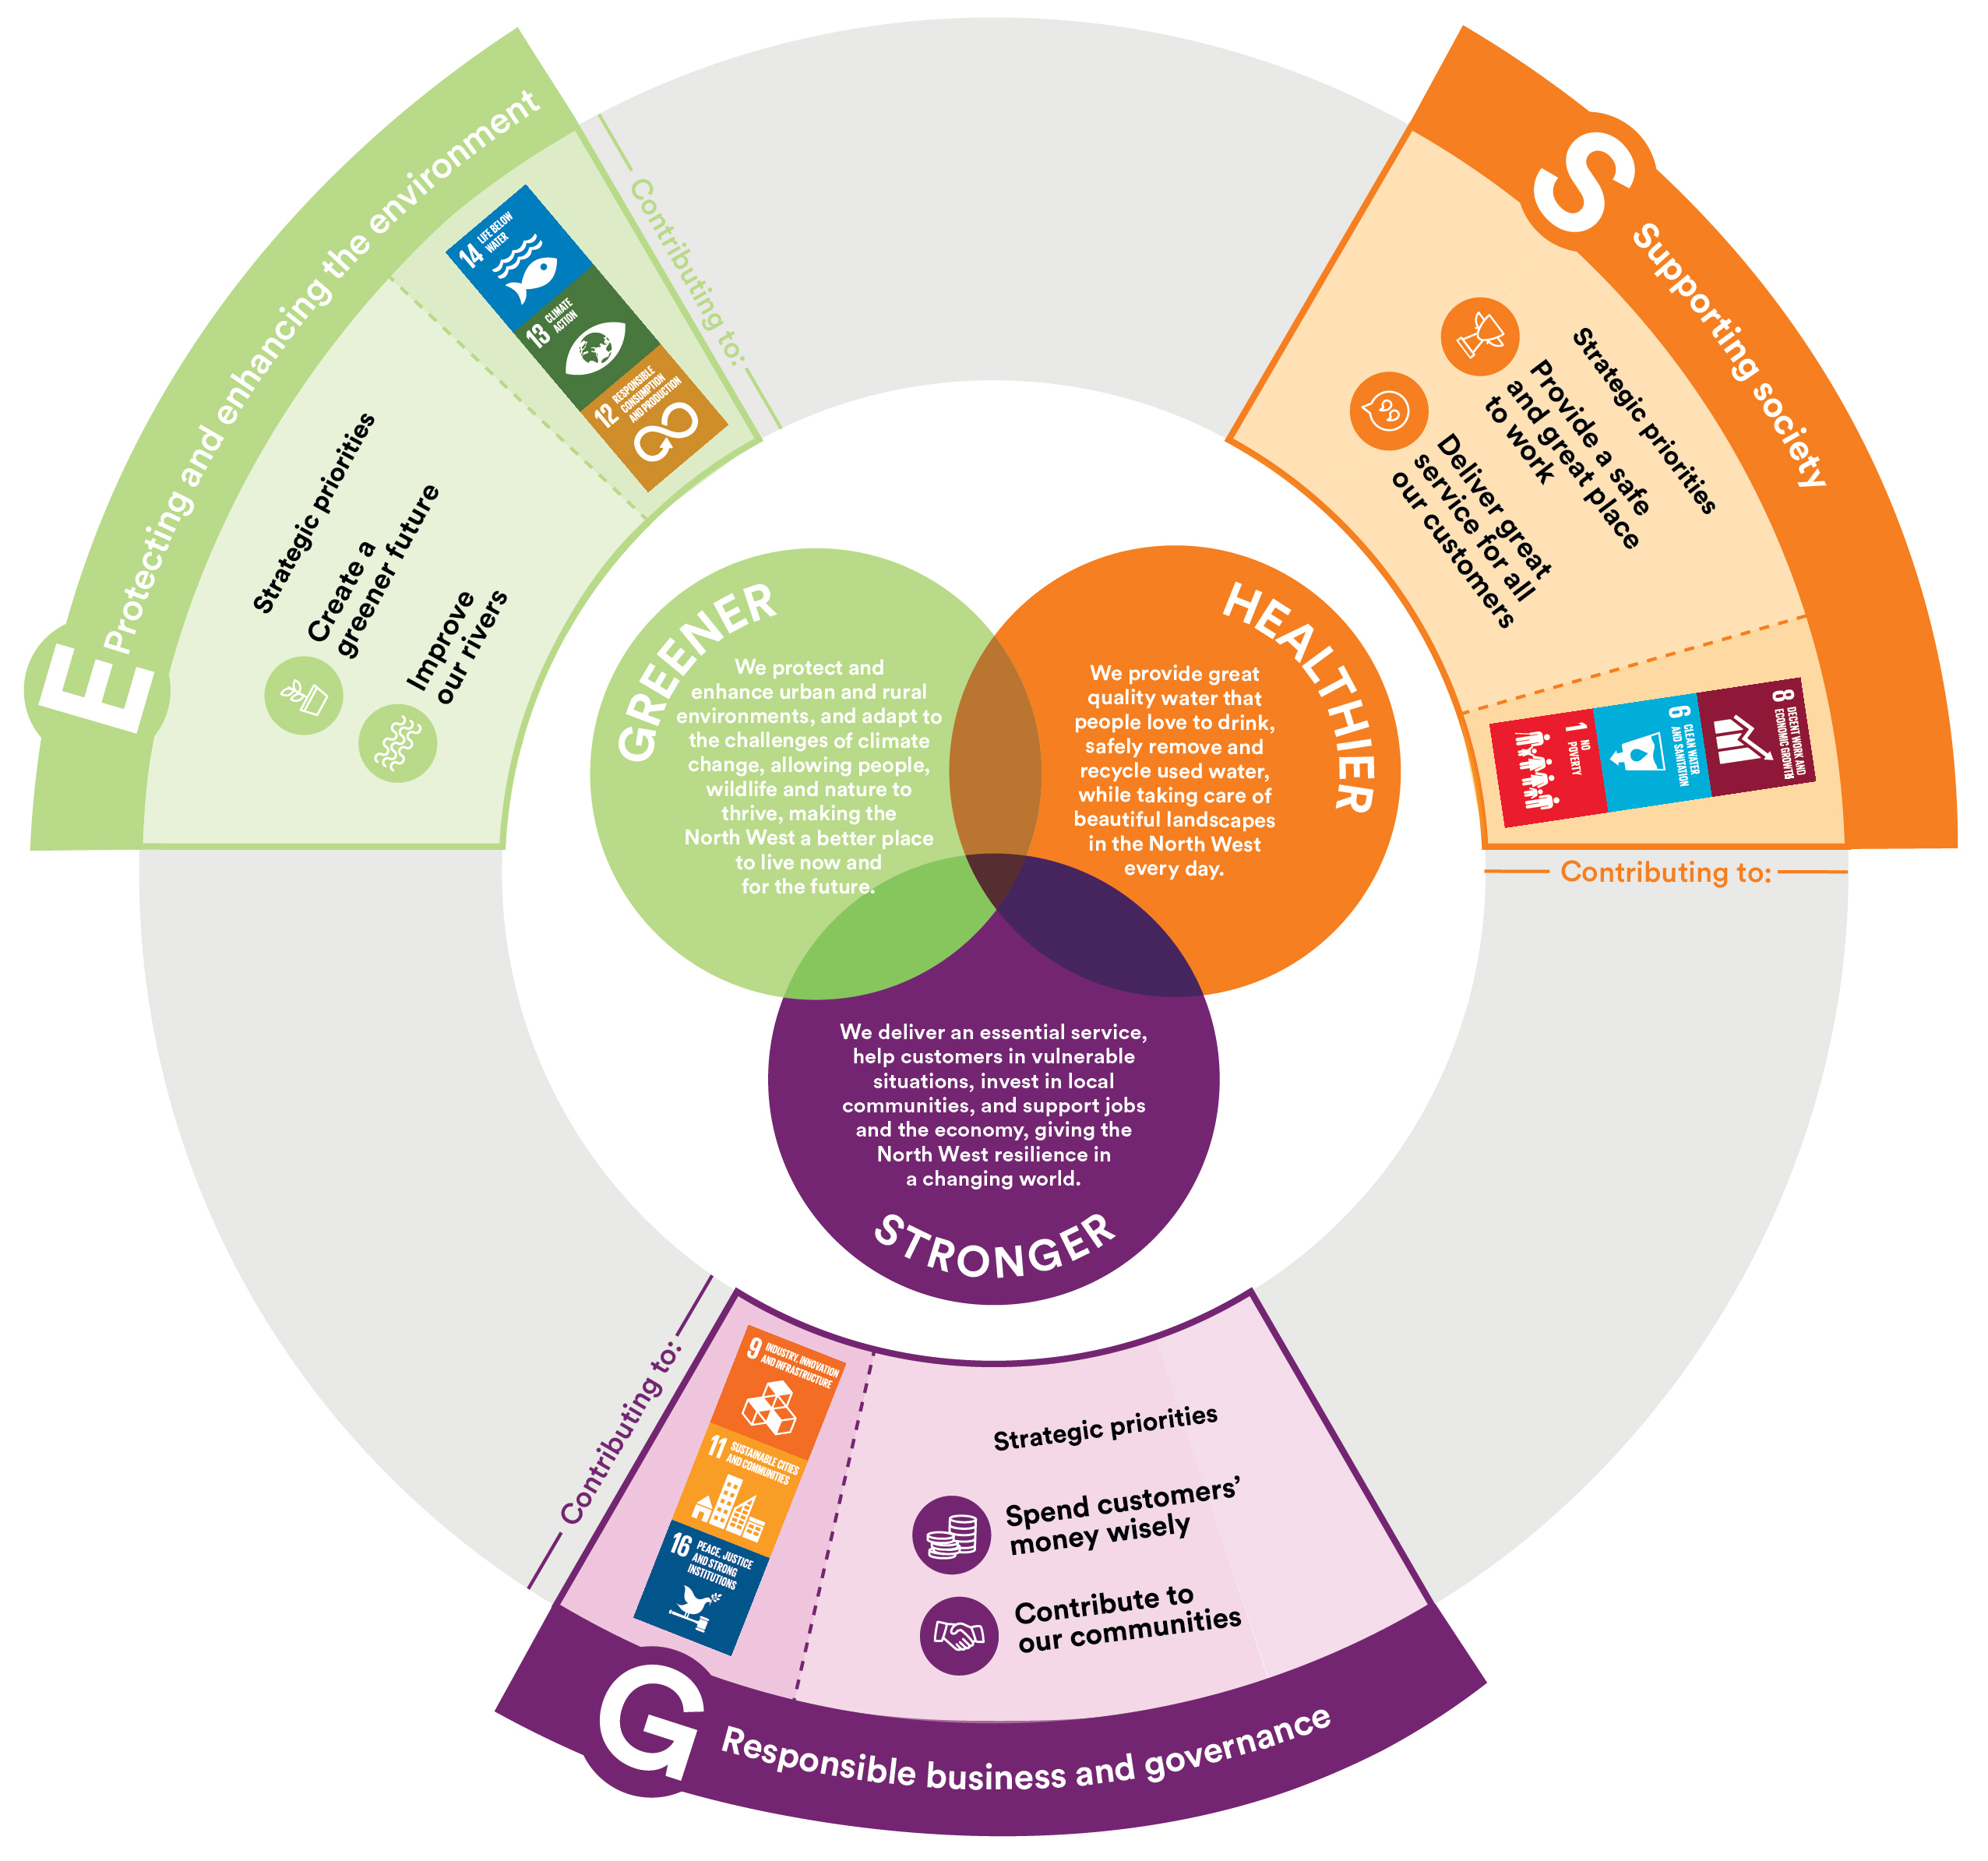
Our strategy to enable delivery of our purpose has six priorities:
Improve our rivers
Create a greener future
Provide a safe and great place to work
Deliver great service to our customers
Spend customers’ money wisely
Contribute to our communities
These strategic priorities permeate everything that we do.

Our purpose and strategy are intrinsically linked to ESG
Environmental, social and governance (ESG) matters are strongly integrated into the way we approach our business and the way we monitor our performance – everything aligns under the stronger greener and healthier ambition within our purpose.
The below infographic demonstrates the alignment between our purpose and our six strategic priorities with ESG.
Why invest in United Utilities?
|
Our performance in 2022/23
Our operational highlights

Delivering our purpose is about more than just providing customers with water and removing wastewater. Our operational highlights provide an overview of how we are creating a stronger, greener and healthier North West.
- We met or exceeded 83% of our regulatory performance commitments this year – our best ever performance
- We were once again the top ranked listed company for customer satisfaction, ranked fourth among the 11 water and sewerage companies (WaSCs) and fifth overall out of 17 companies including those that provide water-only services, and expect to earn a £3 million reward

- We delivered our best ever performance against our leakage performance commitment and achieved zero serious pollution incidents in 2022/23
- We achieved all of our Better Rivers: Better North West commitments, making good progress towards out 2025 targets, and have driven a 39% reduction in reported storm overflow activations since 2020
- We continue to deliver strong environmental performance, having been awarded the two top rankings – either a three of four star award - in the Environment Agency’s annual environmental performance assessment every year since it started in 2011

- We have supported over 330,000 customers with affordability support so far during this five year regulatory period
- Our approach to responsible business has ensures consistent upper quartile performance across a range of ESG ratings and indices, we are a member of the Dow Jones Sustainability World Index, improved out latest CDP score to A-, and in the Sustainalytics assessment we continue to be classified as low risk and a top ten performer in the Utilities industry group.
Our financial highlights
| Year ended 31 March |
2023 £m |
2022 £m |
2021 £m |
2020 £m |
2019 £m |
2018 £m |
|---|---|---|---|---|---|---|
| Revenue | 1,824.4 | 1,862.7 | 1,808.0 | 1,859.3 | 1,818.5 | 1,735.8 |
| Reported operating profit | 440.8 | 610.0 | 602.1 | 630.3 | 634.9 | 636.4 |
| Underlying operating profit | 256.3 | 610.0 | 602.1 | 732.1 | 684.8 | 645.1 |
| Reported profit before tax | 256.3 | 439.9 | 551.0 | 303.2 | 436.2 | 432.1 |
| Underlying profit before tax | (34.3) | 301.9 | 460.0 | 534.8 | 460.3 | 370.2 |
| Reported profit after taxation | 204.9 | (56.8) | 453.4 | 106.8 | 363.4 | 354.6 |
| Underlying profit after tax | (8.7) | 367.0 | 383.0 | 486.3 | 407.9 | 304.9 |
| Reported (basic) earnings per share (pence) | 30.0p | (8.3)p | 66.5p | 15.7p | 53.3p | 52.0p |
| Underlying earnings per share (pence) | (1.3)p | 53.8p | 56.2p | 71.3p | 59.8p | 44.7p |
| Dividend per ordinary share(1) (pence) | 45.51p | 43.50p | 43.24p | 42.60p | 41.28p | 39.73p |
1) Dividend yield of 4.29%, based on closing share price on 31/03/2023 of 1060.0p
| As at 31 March | 2023 £m | 2022 £m |
2021 £m |
2020 £m |
2019 £m |
2018 £m |
|---|---|---|---|---|---|---|
| Non-current assets | 16,835.8 | 13,823.2 | 13,166.2 | 13,215.7 | 12,466.4 | 11,853.6 |
| Current assets | 691.4 | 613.8 | 1,012.9 | 828.4 | 721.4 | 1,149.9 |
| Total assets | 14,527.2 | 14,437.0 | 14,179.1 | 14,044.1 | 13,187.8 | 13,003.5 |
| Non-current liabilities | (11,442.6) | (10,791.0) | (10,152.6) | (9,877.3) | (9,025.0) | (8,911.1) |
| Current liabilities | (575.9) | (688.6) | (995.5) | (1,204.7) | (1,052.0) | (1,141.5) |
| Total liabilities | (12,018.5) | (11,479.6) | (11,148.1) | (11,082.0) | (10,077.0) | (10,052.6) |
| Total net assets and shareholders' equity | 2,508.7 | 2,957.4 | 3,031.0 | 2,962.1 | 3,110.8 | 2,950.9 |
| Net debt | 8,200.8 | 7,570.0 | 7,305.8 | 7,361.4 | 7,067.3 | 6,867.8 |
| RCV gearing(2) (%) | 58% | 61% | 62% | 61% | 61% | 61% |
(2) Regulatory capital value (RCV) gearing is calculated as group net debt adjusted for loan receivable from joint ventures, divided by the RCV (as adjusted for actual spend and timing difference) of United Utilities Water Limited, including the expected value of AMP7 ex-post adjustment mechanisms. Prior year figures have been re-presented for comparative purposes.
| Year ended 31 March | 2023 £m | 2022 £m |
2021 £m |
2020 £m |
2019 £m |
2018 £m |
|---|---|---|---|---|---|---|
| Net cash generated from operating activities | 787.5 | 934.4 | 859.4 | 810.3 | 832.3 | 815.6 |
| Net cash used in investing activities | (593.4) | (639.7) | (549.3) | (593.9) | (627.7) | (723.2) |
| Net cash (used in)/generated from financing activities | (85.0) | (809.7) | (89.7) | (27.8) | (377.4) | 184.7 |
| Effects of exchange rates | (1.3) | 1.5 | - | - | - | - |
| Net increase/(decrease) in cash and cash equivalents | 107.8 | (513.5) | 220.4 | 188.6 | (172.8) | 277.1 |
Economic regulation
Economic regulation is the responsibility of an independent body, Ofwat, whose primary duties are to protect the interests of consumers, to ensure that companies properly carry out and can finance their functions and to secure the long-term resilience of water and sewerage systems.
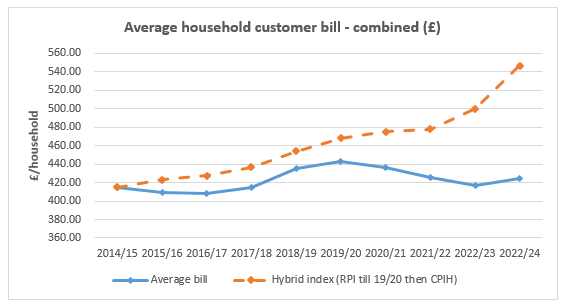
As part of its periodic review, Ofwat sets the prices each company can charge their customers across the period. Average household bills are shown on the chart below.

Capital investment
Capital investment of more than £3bn across the 2020-25 period and is anticipated to increase beyond 2025, driven largely by:
- Enhanced environmental standards with a focus on the removal of storm overflows and phosphate reductions driven by the Environment Act 2021
- Population growth and climate change
- The need to upgrade our water and wastewater networks and maintain our ageing assets
- Continue to provide high quality water to our customers and improve our customers’ experience
- Deliver a cleaner environment to deliver benefits for our communities today, as well as for future generations to come.
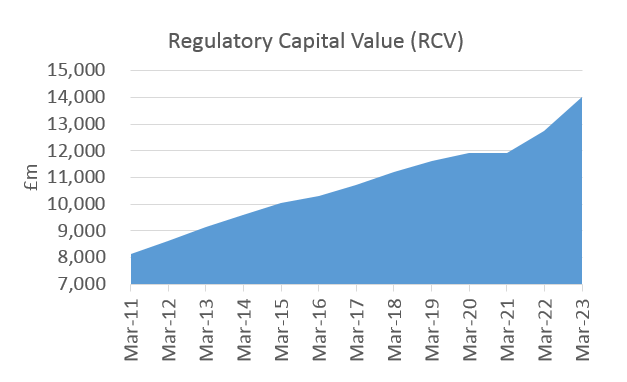
Growth in RCV
Attractive growth since privatisation.
Regulatory capital value (RCV) (as adjusted for actual spend and timing difference) of United Utilities Water Limited now includes the expected value of AMP7 ex-post adjustment mechanisms. Prior year figures have been re-presented for comparative purposes.
For more information please contact:
Chris Laybutt, Investor Relations and Clean Energy Strategy Director, chris.laybutt@uuplc.co.uk, T: +44 (0) 7769 556 858
Anna Oberg, Investor Relations Manager, anna.oberg@uuplc.co.uk, T +44 (0) 7435 939 112
United Utilities Group plc
Haweswater House
Lingley Mere Business Park
Lingley Green Avenue
Great Sankey
Warrington WA5 3LP
corporate.unitedutilities.com
This document contains certain forward-looking statements with respect to the operations, performance and financial condition of the group. By their nature, these statements involve uncertainty since future events and circumstances can cause results and developments to differ materially from those anticipated. The forward-looking statements reflect knowledge and information available at the date of preparation of this document and the company undertakes no obligation to update these forward looking statements. Nothing in this document should be construed as a profit forecast. Certain regulatory performance data contained in this document is subject to regulatory audit.